 LandmAIn
LandmAIn · GIS map atlas
See how infrastructure shapes the land opportunity.
Explore Colorado's eastern Denver metro corridor through four connected maps. Power, fiber, parcel characteristics, and land-use context come together to help development teams focus their site research.
01 · Corridor thesis
Power + fiber backbone
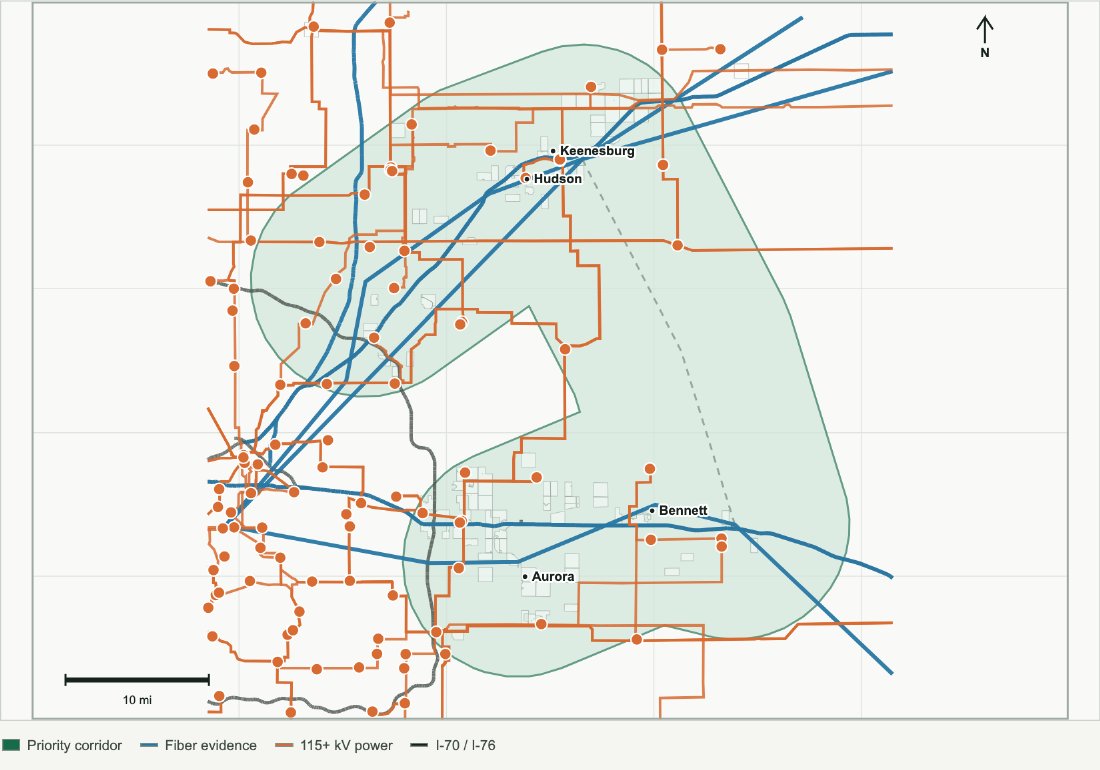
The corridor brings eastern Denver metro land into a shared view of regional power, fiber, and transportation infrastructure.
- Transmission lines, substations, fiber corridor evidence, and I-70 / I-76 provide the regional context for site comparison.
- Each location is evaluated for its land-use pathway, power connection options, fiber access, and water strategy.
- Provider coordination establishes the capacity and service options available to a specific project.
Sources: HIFLD transmission and substations; CDOT highways and fiber-segment evidence; EPA water-system context; county parcels.
02 · Opportunity field
A focused order for site review
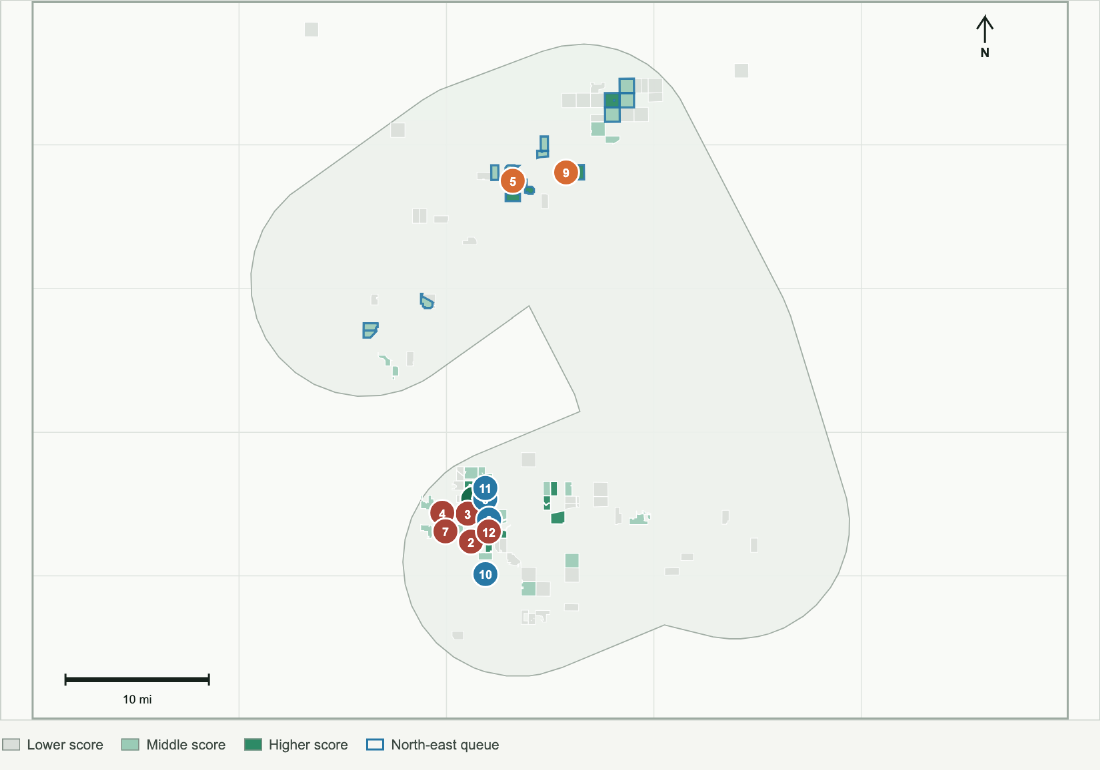
A consistent screening framework helps teams compare large parcels and prioritize the next investigation.
- Color represents the comparative public-data score. Numbered markers identify the manual review sequence.
- Green markers identify front-review cases; blue identifies comparison cases; red and orange identify review and policy holds.
- Zoning, community context, aviation, and site-control evidence shape which opportunities advance.
Sources: County parcel geometry; official zoning and municipal context; derived infrastructure distances; policy-aware review queue.
03 · Parcel evidence
From regional context to local detail
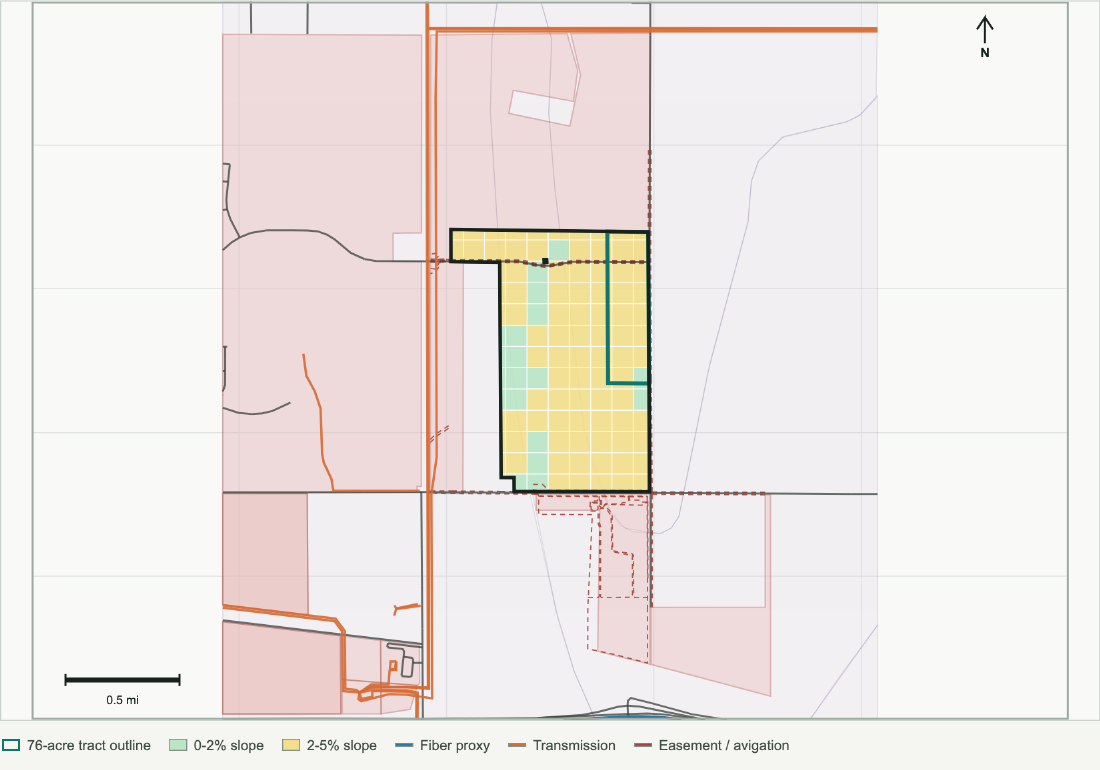
Parcel-level review connects infrastructure relationships with the physical and recorded details of an individual location.
- The broader 493-acre screen includes 110 USGS 3DEP samples and a modeled mean slope of 2.8%.
- An official 2026 deed records a 76-acre site within that review envelope. The displayed tract extent is derived from the deed.
- The coarse terrain model places 493 broader-screen acres at or below 5% slope. Survey, drainage, and geotechnical work refine the development footprint.
- Recorded-tract boundary distances are 1.46 miles to fiber evidence, 0.75 miles to transmission, and 1.38 miles to a public water-system boundary.
Sources: USGS 3DEP; Aurora aerial, zoning, street, right-of-way/easement, airport and noise GIS; HIFLD/CDOT infrastructure context.
04 · Policy and constraints
Understand the development pathway
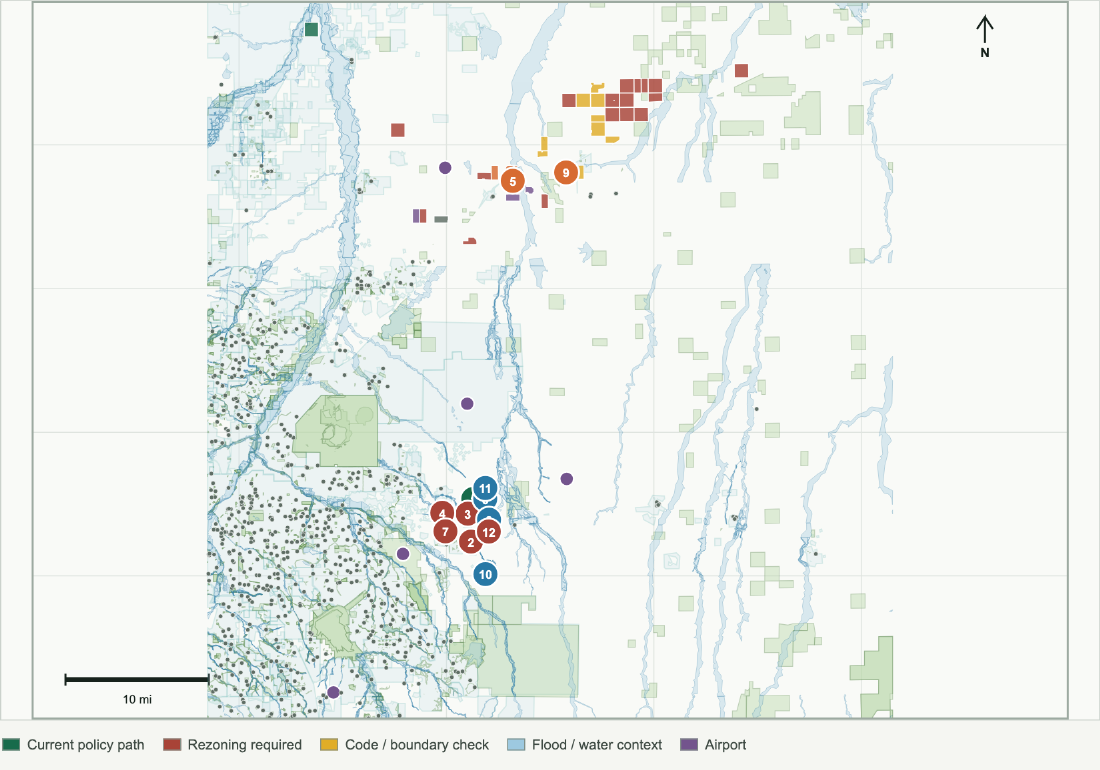
Land-use and environmental context give each opportunity a clearer development agenda.
- Public GIS highlights mapped constraints and potential service relationships for closer review.
- Weld Agricultural zoning carries a policy hold while the applicable land-use pathway is evaluated.
- Jurisdiction, zoning, flood coverage, protected lands, and aviation context guide the sequence of agency and provider discussions.
Sources: FEMA flood hazards; PAD-US protected lands; EPA public water boundaries; Colorado schools and airports; Aurora/Weld policy screens.
Bring the next site question into focus.
These maps present retained public-source screening snapshots. Utility capacity, carrier service, entitlement, water availability, buildable acreage, title, legal access, site control, and investment viability are established through project-specific verification.