 LandmAIn
LandmAIn · Opportunity profiles
Five locations. A clearer view of the development questions.
Compare five representative locations across Colorado's eastern Denver metro corridor. Each profile brings land, infrastructure, and development context together, with a focused explanation of the work needed to evaluate the opportunity.
Representative location 01
Aurora East A
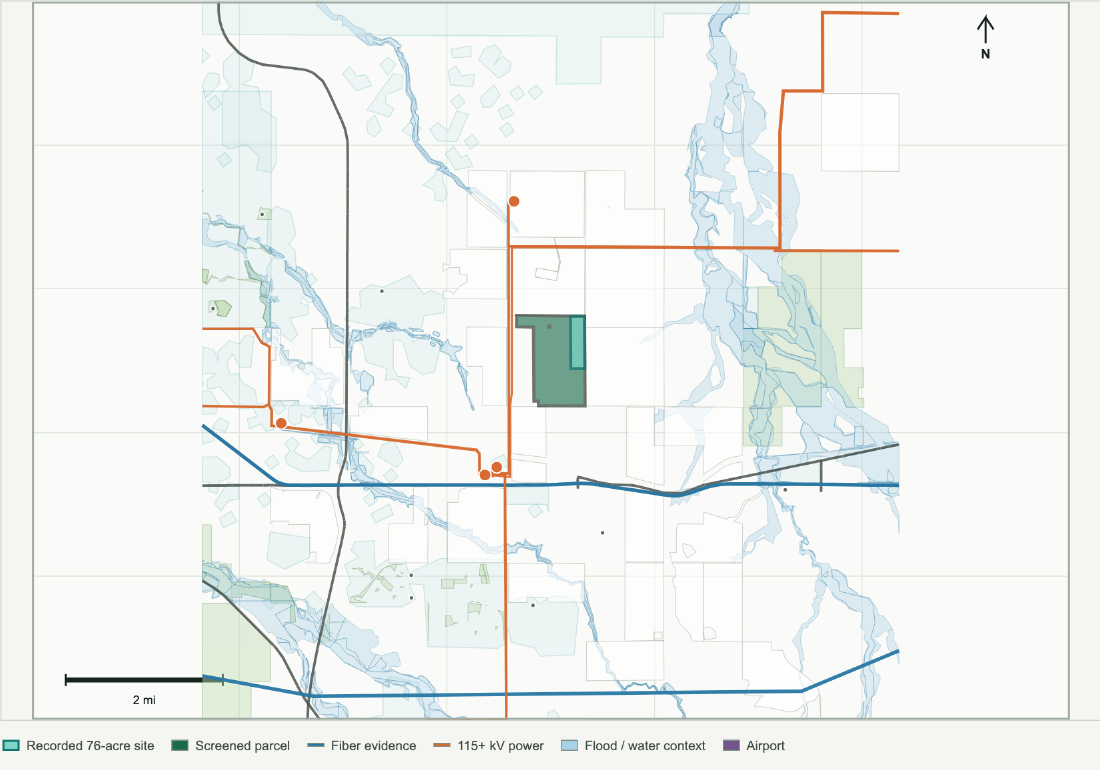
A large metro-edge land screen connects public infrastructure evidence with a recorded 76-acre data-center site within the broader review area.
- Screened land
- 493 acres
- Fiber corridor distance
- 1.46 mi
- Transmission / substation
- 0.75 mi / 1.57 mi
- Water-system boundary
- 1.38 mi
Distance basis: Recorded 76-acre tract boundary; extent derived from the deed. Distances describe mapped relationships; providers confirm service options.
Location context
- The broader public parcel screen covers approximately 493 acres.
- The recorded 76-acre site is shown separately on the map. Its displayed extent is derived from the deed and requires survey confirmation.
- The published screen records public zoning/context code AD.
Reconciling the recorded site with current tax parcels, survey boundaries, title exceptions, and legal access creates the foundation for utility and provider discussions.
Representative location 02
Aurora East B
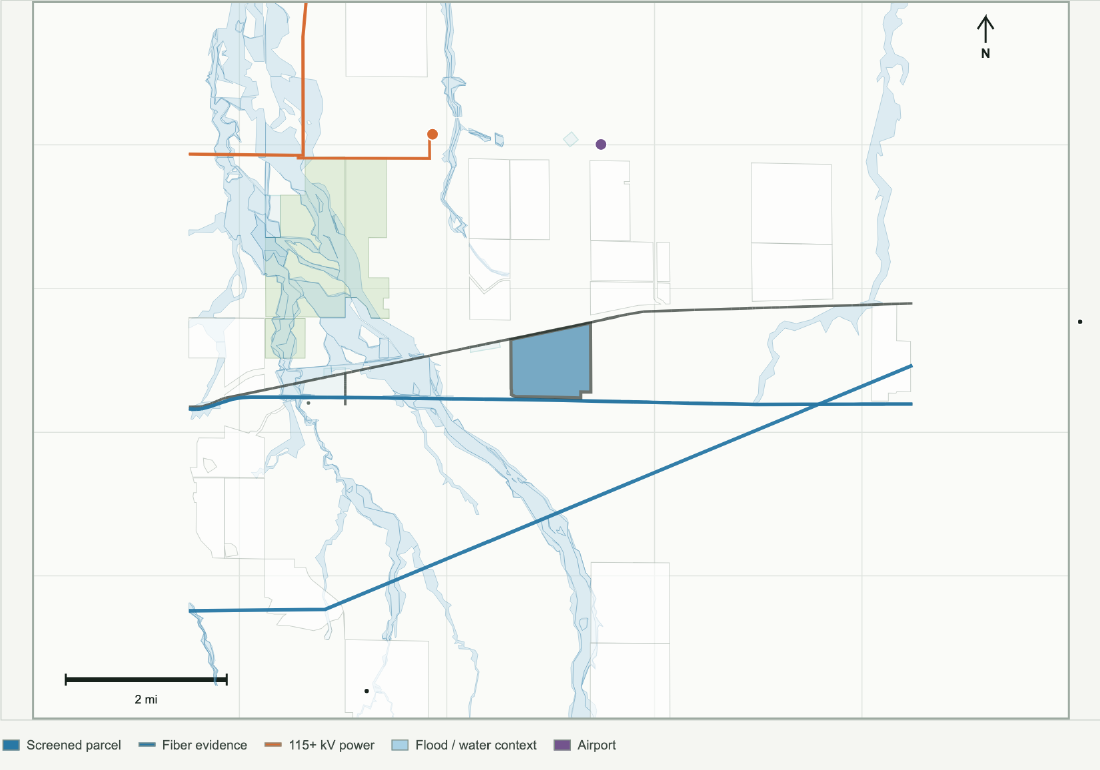
This industrial-zoned location provides a comparison case for evaluating highway and fiber proximity alongside the power connection pathway.
- Screened land
- 512 acres
- Fiber corridor distance
- 0.04 mi
- Transmission / substation
- 2.46 mi / 2.73 mi
- Water-system boundary
- 0.13 mi
Distance basis: Original public parcel screen. Distances describe mapped relationships; providers confirm service options.
Location context
- The public parcel screen covers approximately 512 acres.
- The published zoning/context code is I-2; project-specific land-use review establishes the applicable approvals.
- The screening assessment identifies elevated community-conflict considerations for closer review.
The utility discussion focuses on a practical connection pathway, available capacity, delivery schedule, and potential upgrades alongside the highway and fiber relationships.
Representative location 03
Keenesburg North A
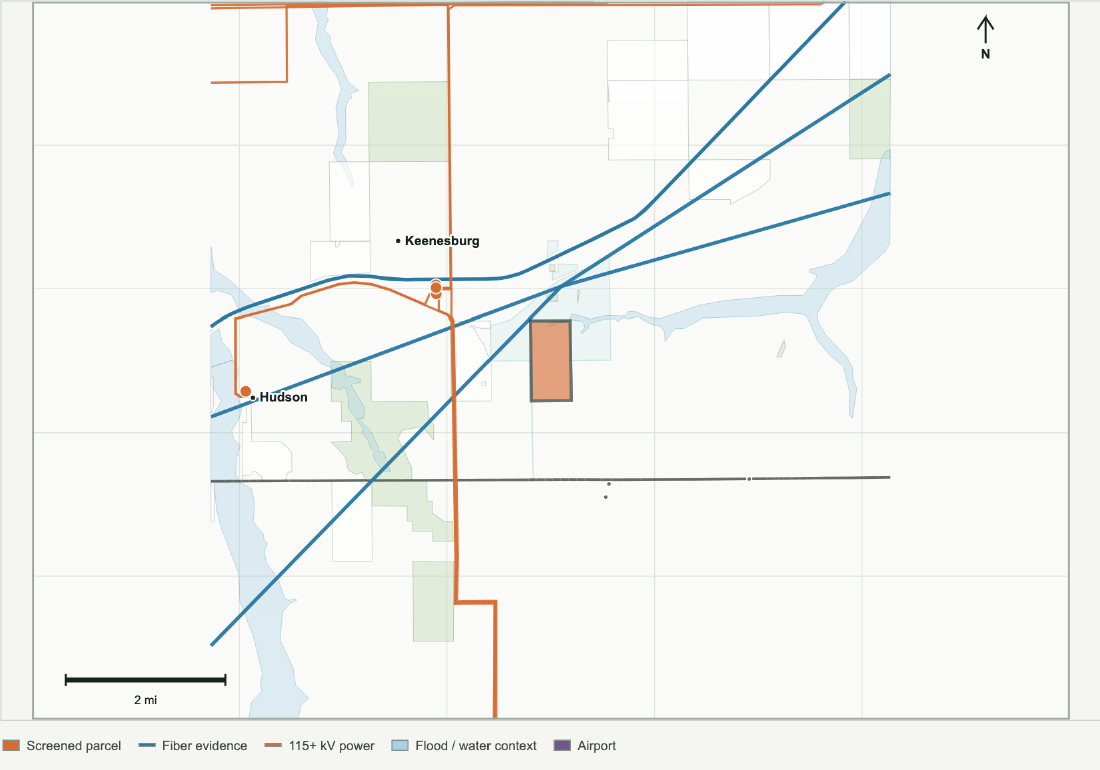
This north-east corridor location brings fiber, power, and water-system relationships into view, with jurisdiction and land-use requirements central to its evaluation.
- Screened land
- 318 acres
- Fiber corridor distance
- 0.60 mi
- Transmission / substation
- 0.96 mi / 1.22 mi
- Water-system boundary
- 0.00 mi
Distance basis: Original public parcel screen. Distances describe mapped relationships; providers confirm service options.
Location context
- The public parcel screen covers approximately 318 acres.
- The published screen leaves the controlling jurisdiction and zoning unresolved.
- The screening assessment identifies elevated community-conflict considerations for closer review.
Confirming the governing boundary and applicable Keenesburg land-use code establishes the development process and the agencies involved.
Representative location 04
Keenesburg South A
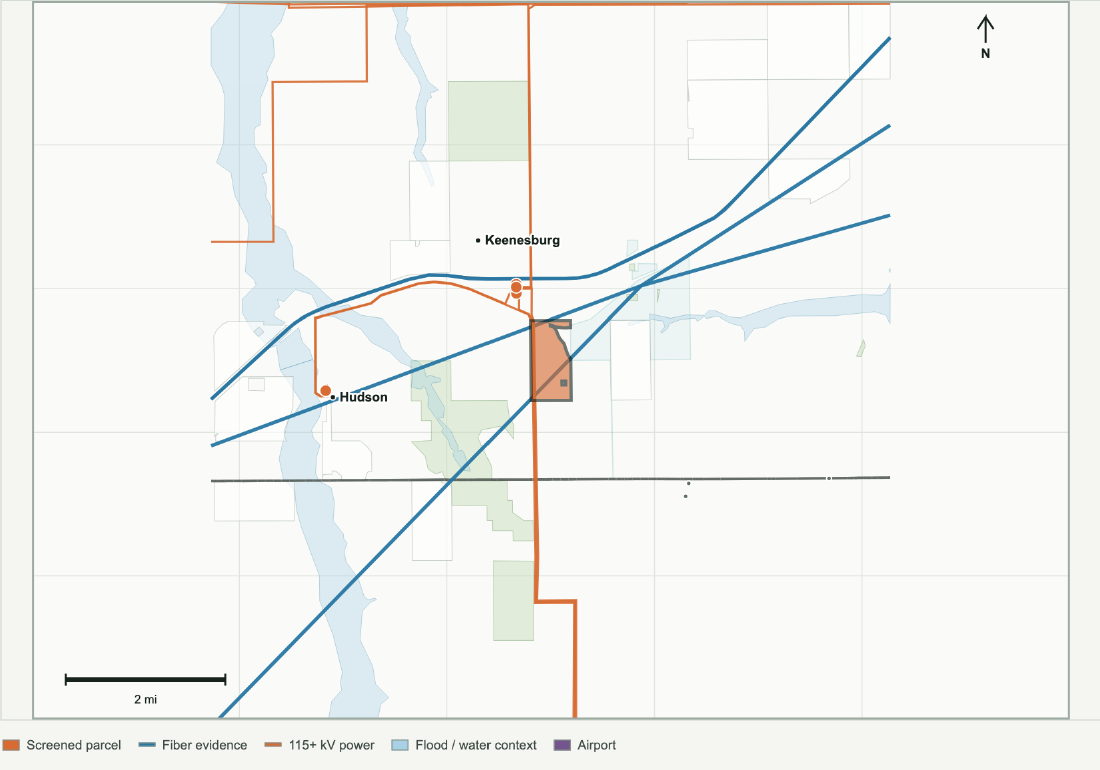
Mapped power and fiber relationships make this location a useful case for understanding how land-use policy shapes infrastructure-led site selection.
- Screened land
- 294 acres
- Fiber corridor distance
- 0.52 mi
- Transmission / substation
- 0.00 mi / 0.38 mi
- Water-system boundary
- 0.00 mi
Distance basis: Original public parcel screen. Distances describe mapped relationships; providers confirm service options.
Location context
- The public parcel screen covers approximately 294 acres.
- The published screen records Weld Agricultural zoning, code A, which prohibits data-center use under the reviewed policy.
- The screening assessment identifies moderate community-conflict considerations.
A discussion with Weld Planning establishes whether an industrial rezoning application is available and supportable under the applicable policy. That pathway is central to further project evaluation.
Representative location 05
Weld Industrial Context
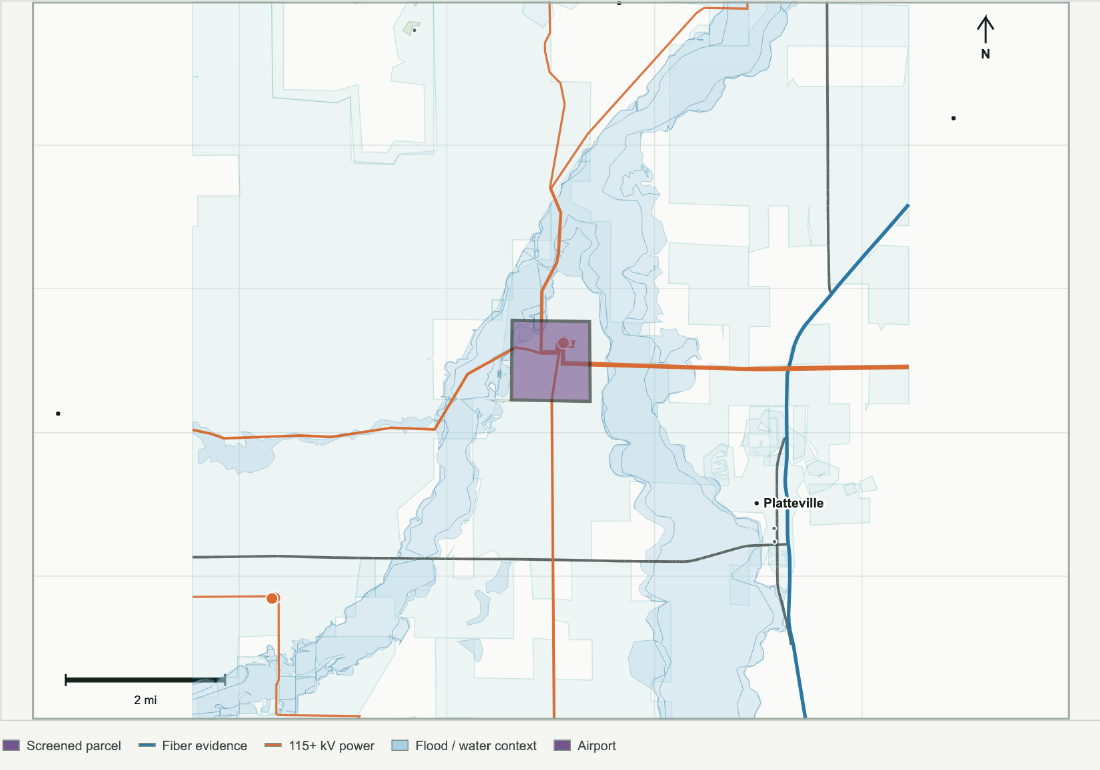
This location pairs industrial zoning with mapped power infrastructure and illustrates the role of ownership and site availability in development research.
- Screened land
- 628 acres
- Fiber corridor distance
- 2.46 mi
- Transmission / substation
- 0.00 mi / 0.00 mi
- Water-system boundary
- 0.00 mi
Distance basis: Original public parcel screen. Distances describe mapped relationships; providers confirm service options.
Location context
- The public parcel screen covers approximately 628 acres.
- The published zoning/context code is I-3, with a site-plan review pathway identified in the policy screen.
- The source research identifies utility ownership, making market availability a key question. The community assessment calls for monitoring.
Establishing owner interest, transaction options, and developable land availability clarifies whether a project can pursue site control before committing to further diligence.
Connect the site screen to project verification.
Each profile gives development teams a starting point for three coordinated conversations.
Power delivery
Utilities establish capacity, deliverability, the connection pathway, timing, and upgrade costs for the project's load.
Fiber connectivity
Carriers confirm routes, splice access, diverse paths, installation requirements, and commercial terms.
Water and wastewater
Providers confirm service eligibility, capacity, infrastructure requirements, and willingness to serve the proposed use.
Map sources: County parcel and municipal geometry; HIFLD transmission and substations; CDOT highways and fiber evidence; EPA water-system boundaries; FEMA flood hazards; PAD-US protected lands; Colorado school and airport context. The first profile also includes recorded-deed research.
These profiles preserve the published public-source screening snapshots. Acreage describes screening areas rather than confirmed buildable land. A distance of 0.00 miles indicates mapped overlap or proximity rounded to the displayed precision; it establishes neither capacity nor a service commitment. Zoning, jurisdiction, and ownership findings require current confirmation. Survey, title, legal access, site control, and project-specific approvals complete the development assessment.